
Signature Method in Analysis and Prediction of Stock Price
Background and Motivations
The raw motivation for signature method is to find a solution to controlled SDE. However, its practical usage is also wide recognized. It could be deemed as an extraction of the unique feature of a path. It has been reported that signature could efficiently formulate the dynamics of path-dependent data. Based on this, it could thus be applied to the area of stochastic modelling and statistical machine-learning.
Stock market data is a typical stream of path-dependent data, and signature could satisfy the following two core aims:
- Extract the feature of the dynamics of market behavior for further analysis and prediction.
- Compress the data - Normally we just need signature truncated to the second order, this would be much smaller compared to raw data. (dimension of a stream of 2nd signature is 7, no matter how long the data is).
Signature in Classifying the Stock
In this and the following section, the signature is computed by the esig package on python.
A direct question is that could signature really tell the difference between different stocks? If it could recognize the unique feature of the stock, it should be able to classify different stocks. Hence we compute and plot the second order signatures of two different stocks. We could see different shape in the two clusters.
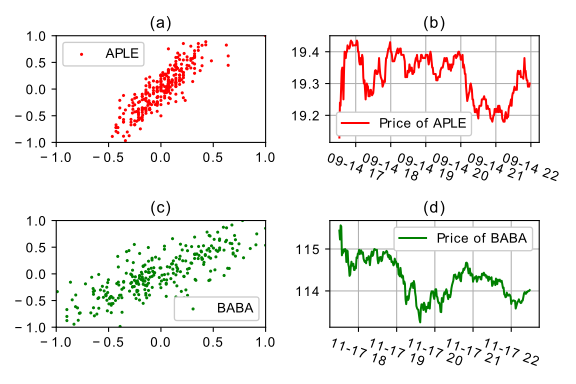 Two stocks are presented and clustered by signature.
Signature method in Predicting the Stock
The ability to predict of signature and its accuracy have been widely discussed by many papers. In this paper, we would consider its usage in more complicated scenarios compared to traditional Machine Learning method.
Extensibility
By Extensibility, we mean how this method would work when we need to reproduce the predictions based on the predicted set. For example, we are trained on 2020-01-01 to 2020-12-30, and make predictions from 2021-01-01 to 2021-03-31, then, regenerate a prediction based on the set 2020-03-31 to 2021-03-31, and realized an ‘extended’ prediction on 2021-04-01 to 2021-06-30.
 This is the price predicted and extended based on linear regression model, we could witness the prediction is acceptable but the regenerated ones are totally incorrect
 .png) This is the regenerated set from signature method. It captures almost all the dynamics although there is a gap between actual prices.
This is the regenerated set from signature method. It captures almost all the dynamics although there is a gap between actual prices.
We could witness the prediction of signature is sightly impacted by the re-generating process. In this section and the following sections, we would find that the actual value of price couldn’t be fully captured by signature method, but it successfully capture the dynamics. Be aware, for stocks, we just need to know the dynamics and that’s enough to make profits.
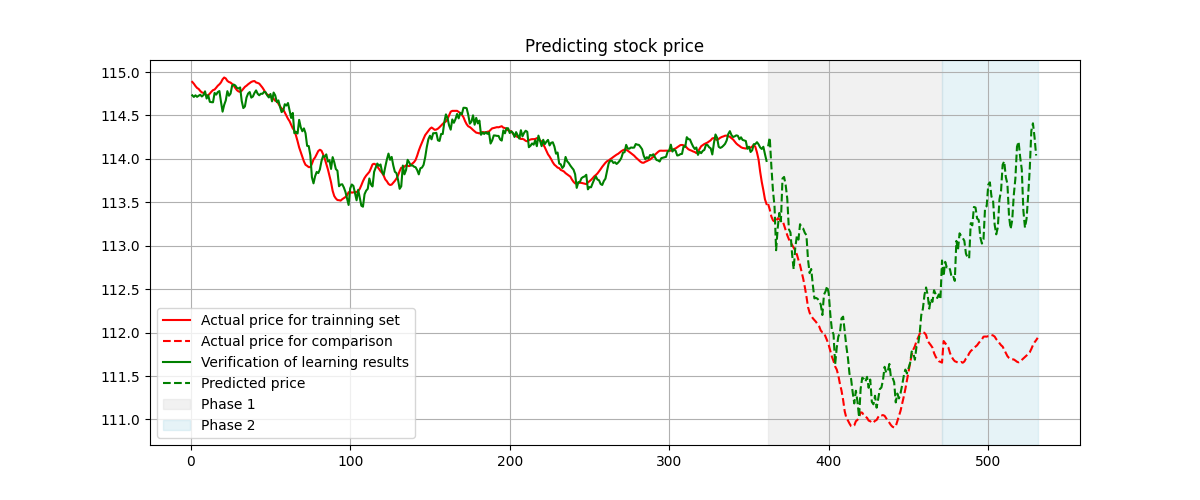
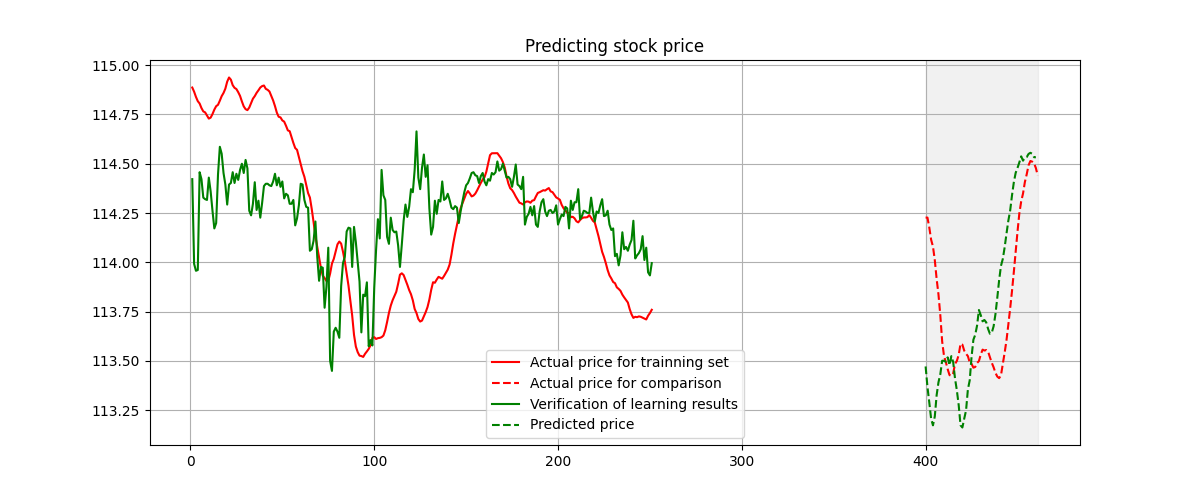
Reliance on Timeliness
For this part, we consider how accurate the prediction is if we don’t use the latest data. For this, we are going to explore the timeliness impact, since:
- The most up-to-date data is not very easy to obtain for stock markets. There could be gaps between training and prediction data.
- The characteristic of the stock should be its property that wouldn’t change from time to time. That is, if we could extract the characteristic of a stock, it would be consistent on when we extract them. The characteristic of the same stock extracted from Phase 1 and Phase 2 should be the same.
As from the following figure, we could witness the prediction is still acceptable under the existence of a time gap between learning and prediction set. 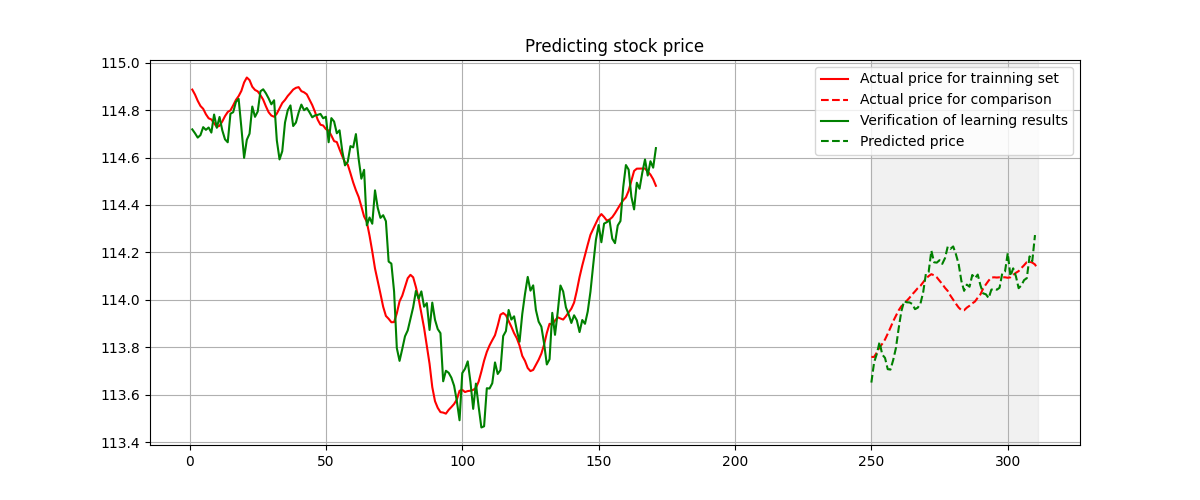 Prediction when the gap between prediction and training set exists.
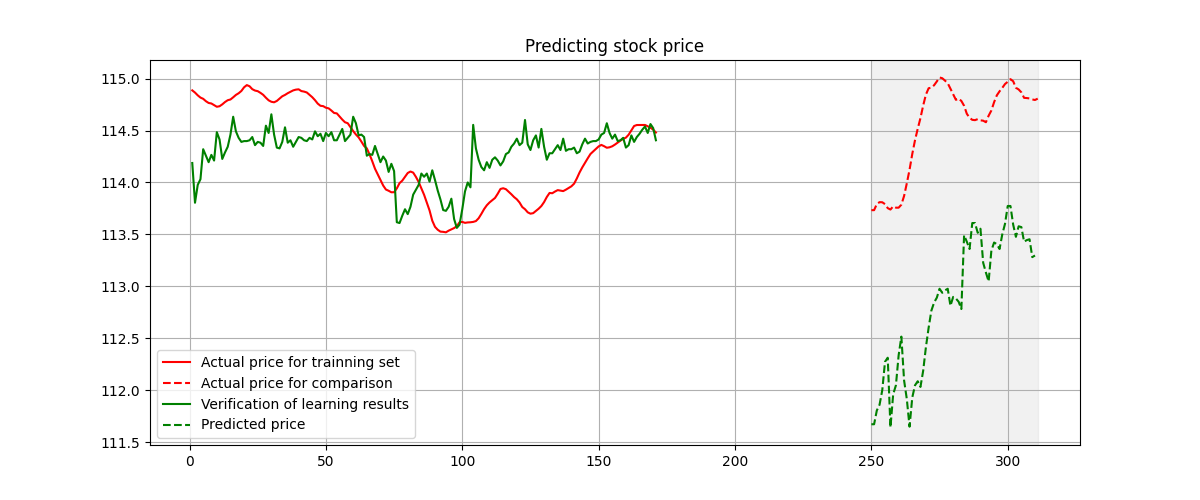
Reliance on the Training Set
Here, we would consider how the prediction would react to a decreased training set. With less training data, would the accuracy of predictions be remarkably affected? This is also reasonable, as:
- If the training set is smaller, the dimension of regression model could be remarkably decreased. - Compuational Efficiency Purposes.
- The size of training set wouldn’t be a critical factor as long as it is sufficient for understanding the underlying mechanism.
 Prediction based on 380 points and 280 points of stock price.
What we could witness is that, if we decreasing the training set from 380 points to be 280 points, the prediction is still acceptable. This shows the signature method is a convincing and efficient method.
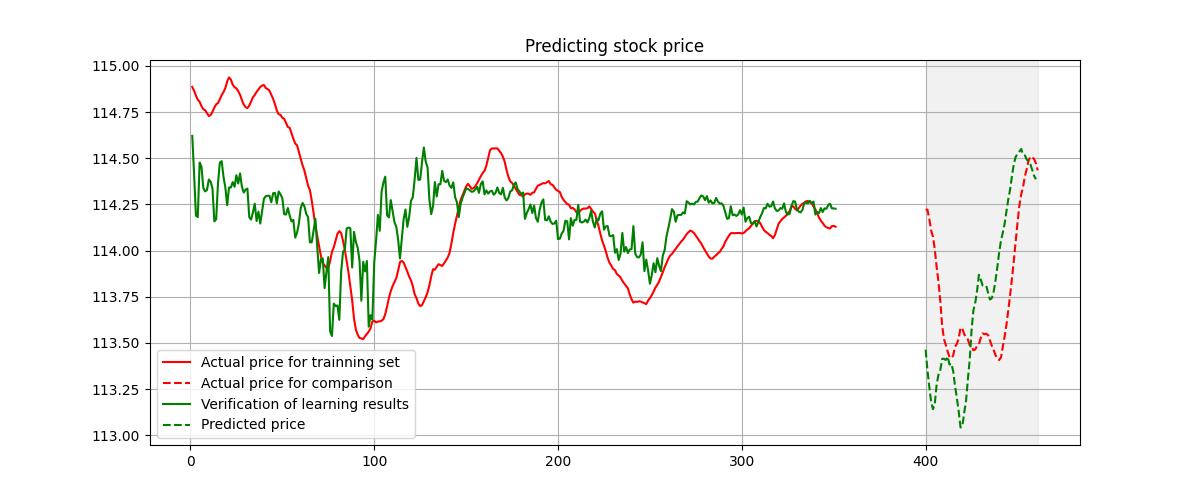
Cross Training
Cross training is an idea that we train the model by A, but test it on B, where A and B are similar asset. The motivation is trival, as the paper by Sirignano and Cont, there are universal mechanism behind stock markets. In other words, if A and B are corelated, we should have good predictions by cross training.
 The prediction based on cross training. As from the figure, we could witness a close prediction by the cross training.
This work is still in progress.
Acknowledgements
Thanks the support of TaiLong Bank and the Hui-Chun Chin and Tsung-Dao Lee Chinese Undergraduate Research Endowment.