
Analysis of Tick Data for High Frequency Trading
Abstract
In this project, I implemented C++ method to analyse the tick data for 100 Scandinavian blue chip stocks. I considered statistics of tick and trades in terms of mean, median and maximum. As advised, I also considered the round number effect. Some sanity check is conducted as well, by for example, checking the scale of the output. Considering the needs from industry, my top priority is efficiency in processing data and the reliability of measurement, then comes the precision. The final version of the code only cost less than 100MB and would finish within seconds. Finally, for the code, we heavily used containers of map in this implementation.
Codes
Codes are available on my repo
Pre-Start Check & Analysis
Considering the size and the specific requirement of the data, we first of all reviewed the CSV file.
Completeness
The CSV is checked. It is witnessed there is no incorrect data during transmitting. The only thing is that the first 72 rows have 15 columns while the rest are in 16 columns. However, we don’t need the 16th column. In other words, it is ready to proceed.
Precision and scale of the Data
We check to what precision / scale the data is recorded. This would be useful for processing the median. Here, we found the spread is recorded at different scale, while the trade time in seconds is recorded with the precision of 0.1s. Suppose we want to find the median of trading time, an idea is that we could try counting method, which would discuss in the following section.
Crucial Idea
These ideas are used for efficiency or better illustration purposes.
Map
Map is the central structure in this work. Since the tick data contains 100 stocks, and each of the stocks are updated randomly, we have to set an index to find the location of the stock’s data, then update it. The advantage of map is that it is very efficient in finding it by its index. We constructed three types of maps, both of them are indexed by string type, which is the stock name.
typedef map<std::string, std::vector<double>> mymapmymapis mainly used for dynamic programming. The first part stores the stock name for index, the second part is a vector that stores all the required data, which would be updated when reading line by line.typedef map< std::string, std::vector<vector<double>> > trademaptrademapis used to store the trade and bid - ask information. Since we are going to compute the time between trades and ticks, we need to quiry the time of last update.typedef map< std::string, medianclass> stock_medianmapstock_medianmapis a bit complicated. It is used to store median. We would further discuss what do classmedianclasscontains in the following section. At this stage, we just need to hold that it is also indexed by the stock name, and stores the median of the stock’s bid-ask spread, tick and trade update times.
Median - Counting
For median, we are aware that we cannot use the normal dynamic programming method. Here, we tried a counting method. Since we are aware that the time between trades and tick changes are in the precision of 0.1s, and are generally very short, we could infer that the change times are generally of very few selections. We just need to count how many times do one of the selection appear, and then we could get the median. Hence, we constructed the following structure:
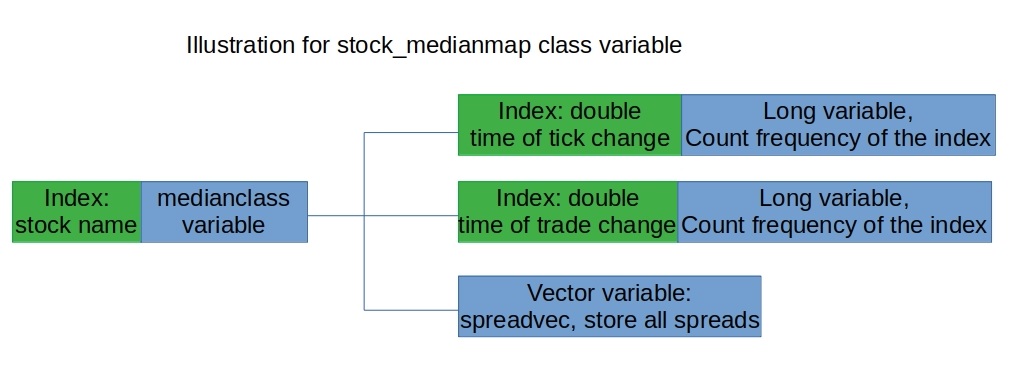
typedef map< double, unsigned long> medmapmedmapis used to count the frequency of the index. For example, suppose we record one more instance of trade time of 0.1s, we just domedmap.find(0.1)->second++
However, for the spread, we cannot do this, as there could be as many selections / choices as the scale of the csv file. Hence, we set up a class medianclass, which contains two medmap, storing the information of tick and trades, respectively, along with a spreadvec, which saves all the spread.
Dynamic Programming
Dynamic Programming is a method that dramatically decrease the usage of memory. Since we don’t need to store all the information, we just read them line by line and we could already get most of the required data. For example, for mean value, we calculated as below: [\mu_i = \mu_{i-1} \frac{i-1}{i} + \frac{x_i}{i}] (\mu_i) is the mean when we read the (i)-th input (x_i).
Round Effect
For the round effect, we didn’t mechanically count how many zeros are there in each position, as we have varied length for volumes and prices. Alternatively, we count the density of zeros. We give the rigorous definition below: [f = \frac {N_0}{N}] Here, (f) denotes the density of zeros in other positions, (N_0, N) denotes the zeros in positions other than the first and the last, (N) is the total digits minus the first and the last.
NB: We disregard the first digit. For decimals (number smaller than 0), the first digit is always 0. For the rest, the first digit is never
- Both the cases would misguide the density, hence we disregard the first digit.
NB: For the requirement of the above, we didn’t consider the following two kinds of the digit:
- numbers with less than two digits
Structure of the Code
The following two figures give a basic illustration of the structure of this work.
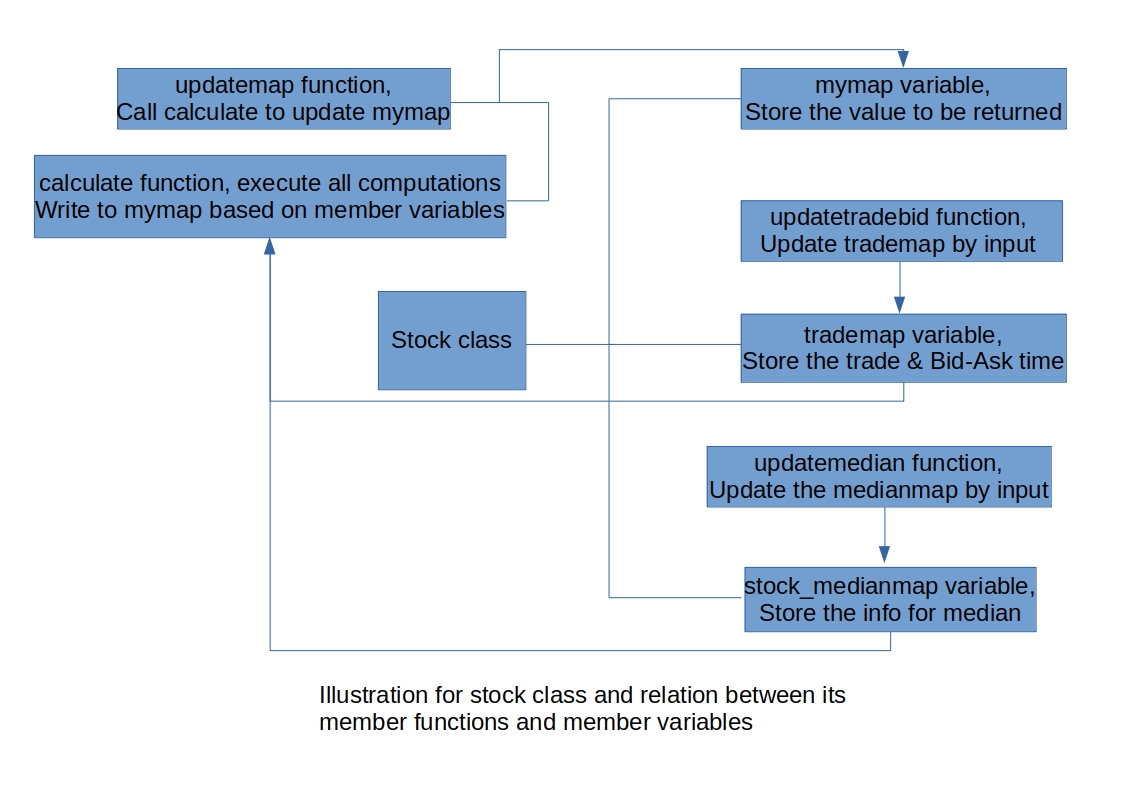
Although there are remarks in the code, we still supply the reader with the following general explanation for main functions.
stock::updatemapThis function reads in the lines, and then call thestock::calculatefunction to execute all the calculations.stock::calculateThis function ither initialises the vector store the required values or calculates all the required values by referring to some member variables ofstockclass.stock::updatetradebidThis function either initialises the map to store the last trade / bid-ask time info or updates the last trade/bid-ask time.stock::updatemedianThis function either initialises the map that is required for computing median, or update the map for median.
The above functions are built based on polymorphism to realise multi-function purposes.
stock::findmedianThis function updates the median in the vector of required values based onmedianmap
Results & Performance
Results
For the result file, please visit the output stock.txt. Here, we briefly discuss some of the findings:
| Desciption | Average Value |
|---|---|
| Mean Spread / Median Spread | 1.49 |
| Longest Time Trade / Tick | 1.32 |
| Probability of zeros at last digit / other position - trade price | 27.21 |
| Probability of zeros at last digit / other position - trade volume | 70.09 |
| Mean trade update time / Mean tick update time | 9.06 |
| Total tick update times / total trade times | 9.26 |
Median is generally smaller than the mean. This implies that the mean value is dominated by some large values.
The round effect do exist in most of the stocks, in both volumes and the prices. (There are still exceptions in very few stocks).
Tick updates much faster than trade updates.
We cite the resources this program require when running to verify its efficiency.
| Method | Memory Required |
|---|---|
| Python | 3.6Gb |
| C++ without optimisation | 500Mb |
| C++ with optimisation for median | <100Mb |
Drawbacks & Explanation
We explain several points that could be confusing or improved.
Computation of median: we could consider online algorithm or other better methods, such as median of median for better efficiency
Median of trades and tick updates is 0: After check by more than one methods, we have to confirm this is the truth. Due to the precision of the tick data is at 0.1s, some of the ticks happen very rapid, thus this makes the median become 0.
Some of the stocks have the possibility of zeros in price in other positions except the last digit as 0: After check, this happens to stocks with fewer trades, or small variations in price. But the volume won’t be impact. This is due the price is very stable, with very small variations, that is hard to generate a zero.
Due to the limit of time, I cannot go through the analysis stock by stock. However, if time permit, we could check, for example, the difference between stocks with higher / lower price, or stocks with more / fewer trades.
Simplified computation of median: we didn’t consider the two variants of median if the vector is odd or even. We just out put the value (x[i]), i =
int(x.size()/2). The vector size is sufficiently big, hence this wouldn’t dramatically impact our value.The loss of “BBHBEAT Index”. We have in total 99 stocks and 1 index. We disregard the BBHBEAT index since we only need to consider the condition code that is none or “XT”.
Sanity Check
We checked the following terms to confirm our data is convincing:
Total read lines: we compare the total lines we read with the original csv file.
The scale of the numbers: For example, all the numbers should be non negative. The update frequency of the tick / trade should in proportional to its time gap.
The output: For example, if the total stocks amount equal to the given one.
Remarks
The column of the output denotes:
1 = stock name
2 = mean of spread
3 = median of spread
4 = longest time between trades
5 = longest time between tick updates
6 = possibility of having zero in price in positions other than the last digit
7 = possibility of having zero in price in last digit
8 = possibility of having zero in volume in positions other than the last digit
9 = mean of time between trades
10 = median of time between trades
11 = mean of time between tick changes
12 = median of time between tick changes
13 = total times of trade updates computed (exclude ones we disregarded)
14 = total times of tick updates computed (exclude ones we disregarded)
Compile: GNU C++, g++ -o filename update.cpp median.cpp main.cpp, output written to stock.txt